Hi, all
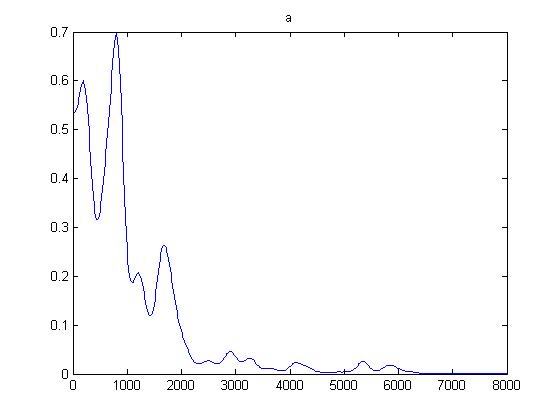
Recently, I used straight(matlab version) to extract spectrum envelope from speech wave, for one frame, I draw a picture using 'plot', I am confused what y-axis stands for, what's the unit of y-axis, obviously, it's not DB,the x-axis stands for frequency.
the more details you can check my picture in the attachment!
Look forward your suggestions!
Thanks!
Li wei
Department of Information Science, Beijing Language and Culture University
Room 208a, Bulding 15, Beijing Language and Culture University, Haidian District, Beijing,P. R. China
Post code:100083